The Monitoring page
Where you connect monitoring tools from the Platform console, and see what each process sent.
This page is for self-hosted installations. On GoRunner Cloud, GoRunner runs this for you.
In Platform, under Settings, open Monitoring. Every platform admin can read it. Only an instance-wide platform admin changes it, and a save asks for your two-factor code.
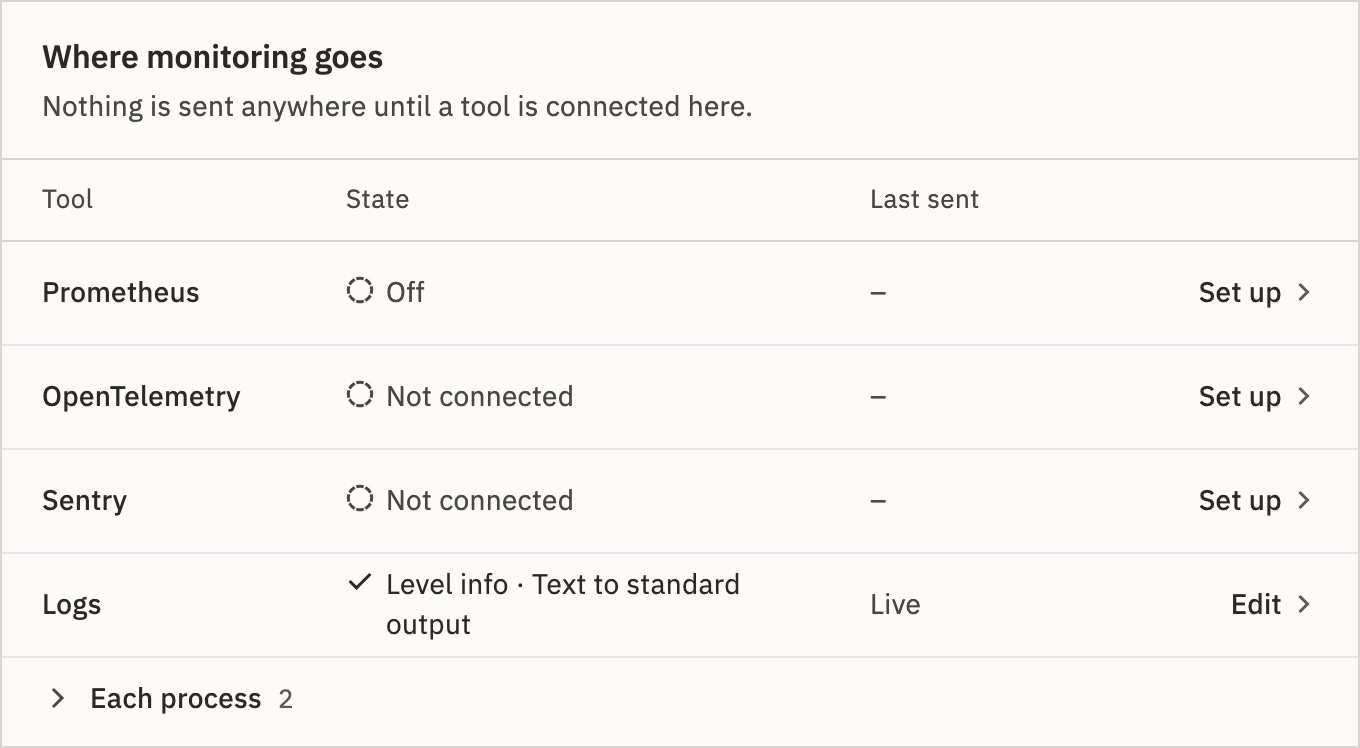
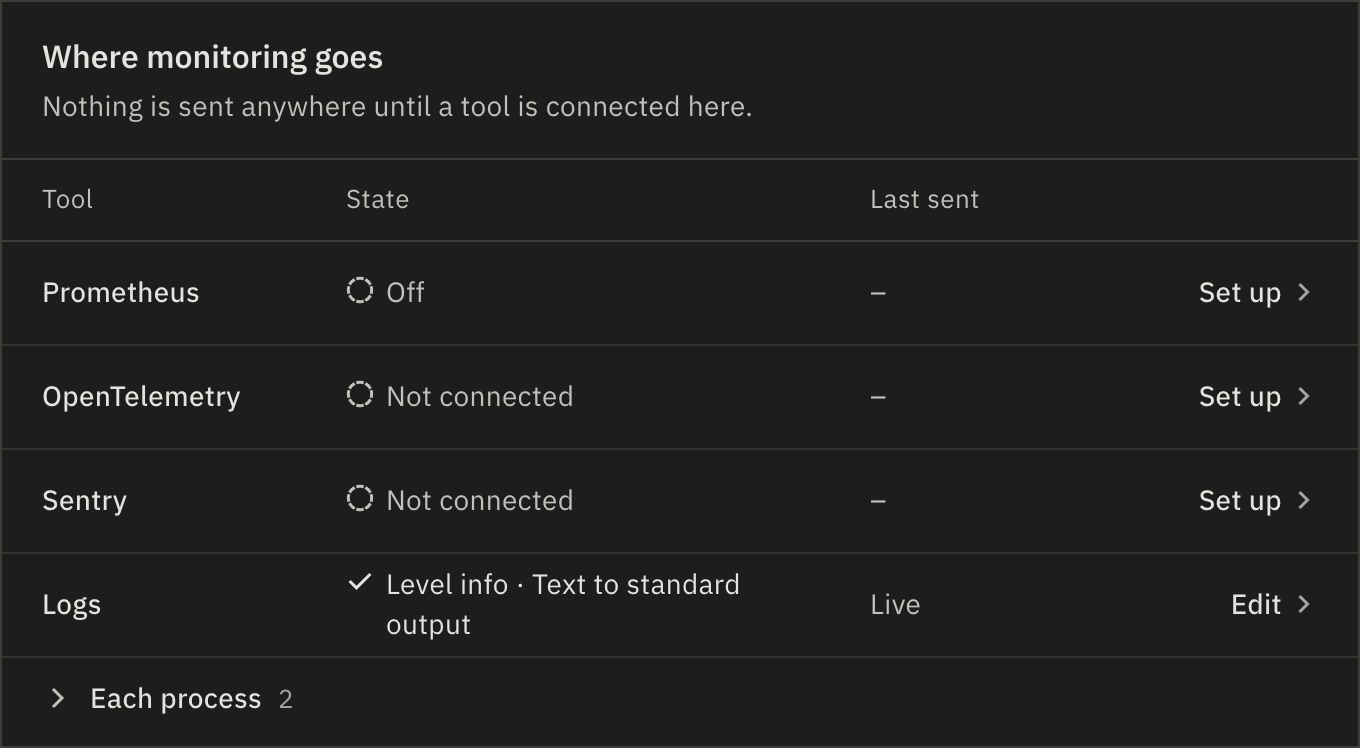
Where monitoring goes
One row per tool: Prometheus, OpenTelemetry, Sentry and Logs, with its State and Last sent. Set up or Edit opens its panel. Nothing is sent anywhere until a tool is connected.
- OpenTelemetry
- Endpoint, Protocol, Headers, Service name, Traces kept (a percentage), and a switch each for traces, metrics and logs.
- Prometheus
- Serve /metrics, its Token, Split by workflow, and a Scrape config naming the processes reporting now.
- Sentry
- DSN and Environment. Send test error sends a harmless error from the API.
- Logs
- The Level. The format is set in
.env.
A saved change reaches every process within seconds, with no restart. Send test sends one item through the connection as saved, and says whether it arrived: “Test trace arrived · 2 ms · 18:26”. It asks for no code.
Each process
What each API and worker process sent in its last report, one column per connection: Sent some seconds ago, Ready, Failing or Off. Processes report every 30 seconds.
Under a failing connection, one line says which process, since when, what went wrong and how much was dropped: “Your tool refused the export: 401 Unauthorized.” Runs are never affected.
Start-up settings
Settings read from the server’s environment when a process starts: database and Redis spans, trace ids on calls steps make, the metric export interval, extra resource attributes, whether OpenTelemetry is allowed, browser error reports, how long the audit log and credential use are kept, and event streaming. Change them in .env and restart.
Settings in .env
A setting also in .env shows locked: “Set in .env as …, which wins over this screen. Change it there and restart.” Secrets are never shown back, only their last four characters; leave a field blank to keep it.
How does the metrics token work?
Make a token… (or Rotate…) asks for your code, then shows the token once, starting grm_, with your scrape config. “You won’t see this token again.”
Rotating stops the old token at once: update Prometheus before its next scrape. Remove… makes /metrics answer 503.
What if the installation is paused?
The Platform console, this page included, is closed until a license is loaded. Monitoring set in .env keeps sending.
Related
- Connect a monitoring toolEach tool’s address and key · 10 min
- The Health pageServices, queues and workers, live · 4 min
- MetricsEvery metric
Checked against 12d85b3b